Specify test and standard germplasm one entry at a time or by selecting a predefined list. Select Next.

The head to head query allows a breeder to compare the performance of test germplasm to standard entries across studies. Breeders can filter and weight results by location or studies.

Specify test and standard germplasm one entry at a time or by selecting a predefined list. Select Next.
In this example 10 test entries are being compared to 10 standard entries, resulting in 100 pairwise comparisons.
A list of traits common to test and standard entries is provided. When Analysis is selected, summary statistics, like MEAN, from the BV single site analysis are included in the list of traits.
Choose the trait(s) of interest for comparison. Choose the direction of selection. Increasing is the default direction of selection, because for most traits breeders select based on larger values. However, some for some traits, like days to flowering (antheisis), decreasing values may be favorable. Select Next.

All of the environments shared by the standard and test entries are listed and can be filtered by location or study. Additional environmental conditions can be added to the table to assist selection. The importance of individual environments can be adjusted by assigning differential weights.
Select the environments of interest and specify weight. By default, all selected environments are deemed important with equal weight in the comparisons. Select Next.

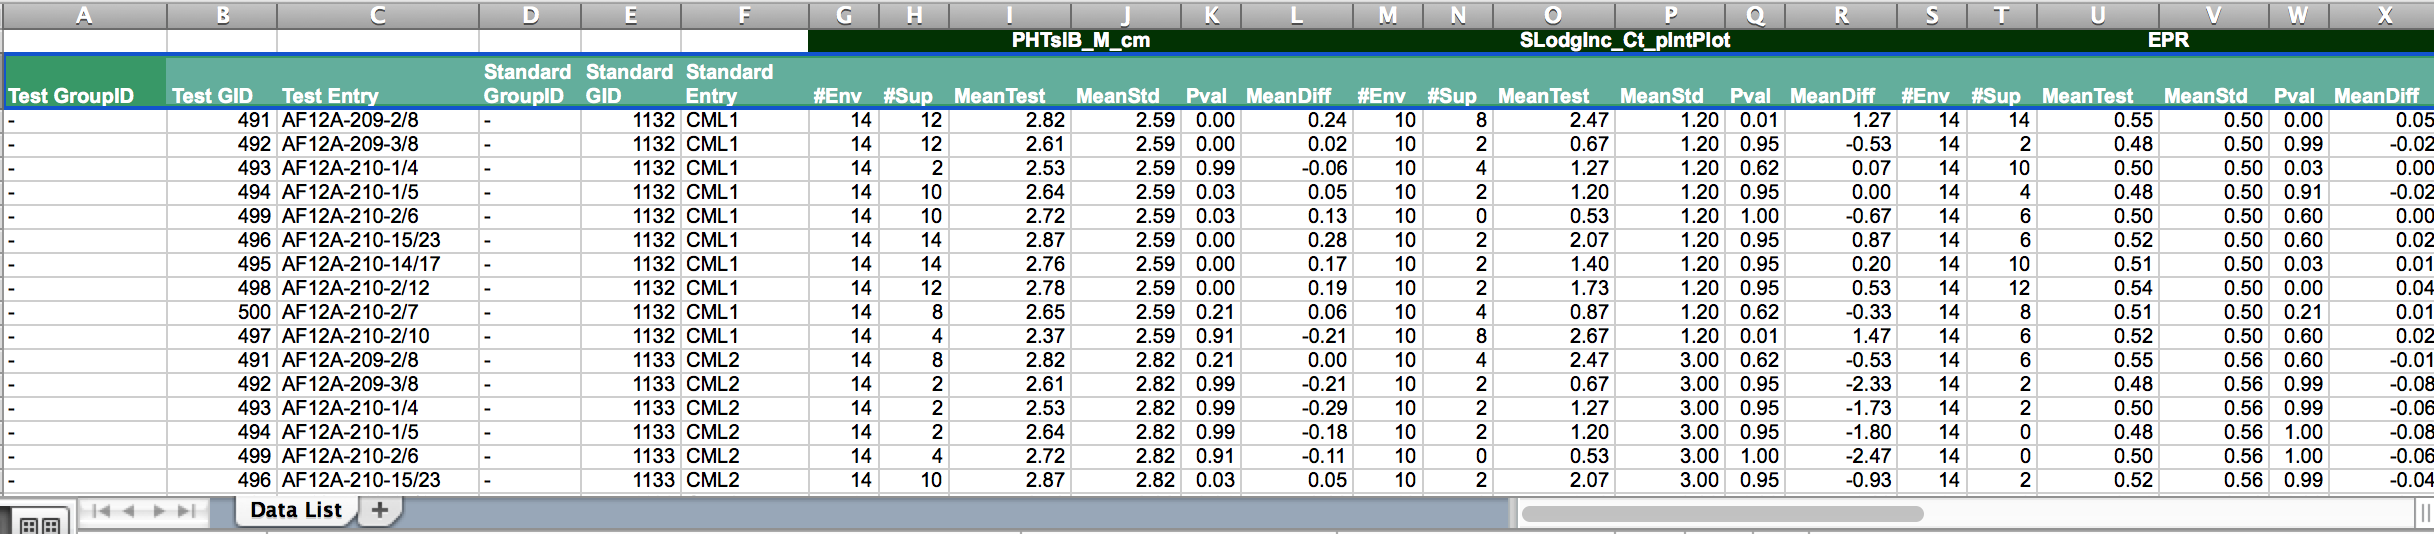
The results are summarized by trait in tabular form. A p-values below 0.05 indicates that the test entry performs significantly better than the standard entry.

7 of the 10 test entries compared to standard entry, CML1, have plant heights significantly larger than CML1. For example, AF12A-209-2/8 (mean = 2.82m) was superior to CML1 (mean = 2.59m) in 12 of the 14 environments where both entries were evaluated. The superiority of AF12A-209-2/8 over CML1 is significant (p < 0.00).
Select Export to create an .xls file.