...
Once the files have been extracted you can run Breeding View and click the Open Project icon and navigate to the directory where the files have been extracted. Select the xml file and click Open.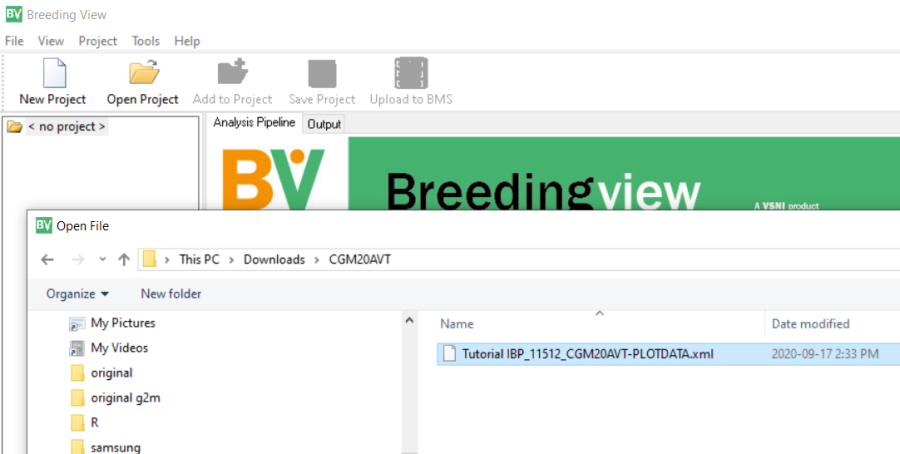
The Single Site Analysis Pipeline will be activated: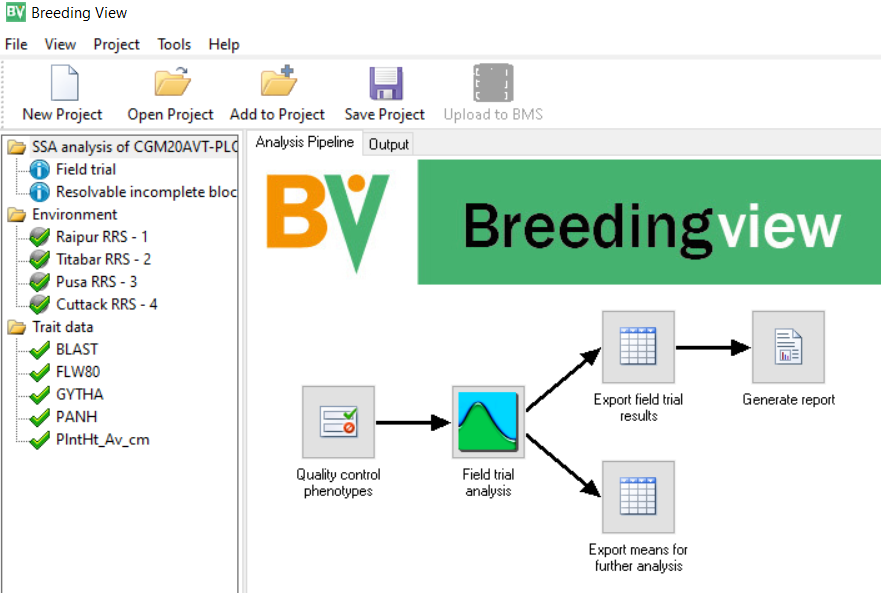
This contains a menu on the left showing the Environments and the Traits which have been specified for analysis. You can select or deselect any and all sites and or traits for analysis. We will leave all the sites and all the variables to be analysed.
The right hand panel shows the pipeline of tasks for single site analysis. Each task has a default configuration, but can also be specially configures by right-clicking of the task icon and selecting settings and adjusting the menu.
For example right click on Quality control phenotypes, click Settings and you will get the following menu: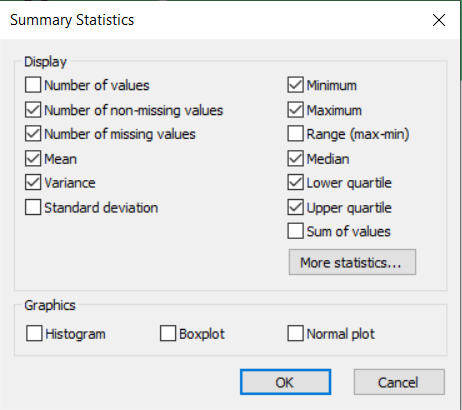
We will accept the default settings for this task. However, right click on the icon for Generate Report and select settings: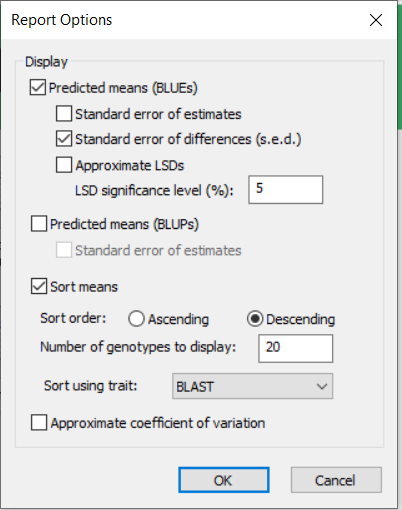
You will see that the table of means will be sorted on BLAST score in descending order and only the 20 entries with largest BLAST score will be printed in the report. This is clearly not what we want, so you should change the setting to 32 genotypes to be displayed and sort using GYTHA and we would also like to see the Coefficient of Variation so we check that box, then click OK.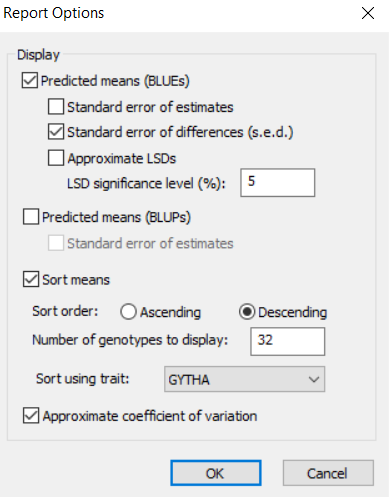
To run the analysis right click on the Quality control phenotypes icon and select Run selected environment pipeline.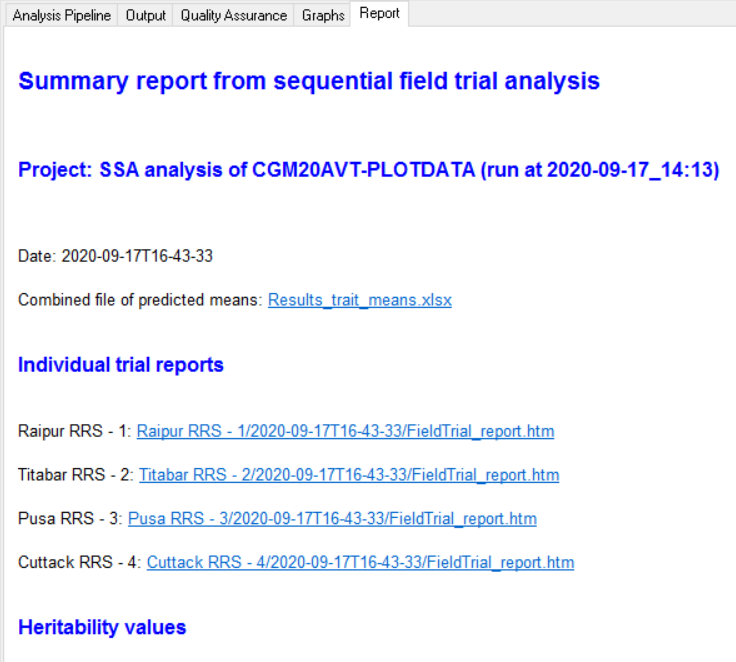
To understand how to interpret the Breeding View output you can consult the Manual under the topic Statistical Analysis:
https://bmspro.io/1823/breeding-management-system/tutorials/maize-single-site-analysis-4-location-batch v21 Statistical Analysis
| Anchor | ||||
|---|---|---|---|---|
|
| Anchor | ||||
|---|---|---|---|---|
|
...
Start the Breeding View Application and click on the Open Project icon and navigate to the directory where the files have been extracted. Select the xml file with the analysis specification: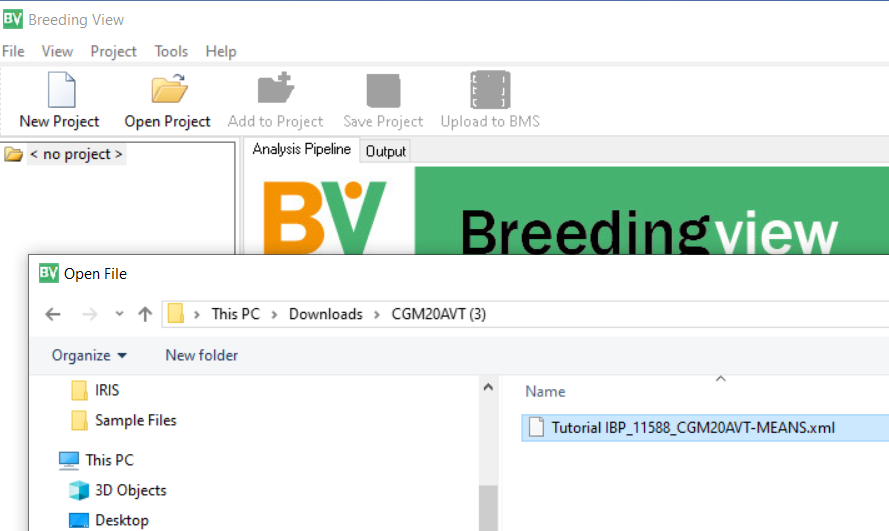
The multi-site analysis workflow will open: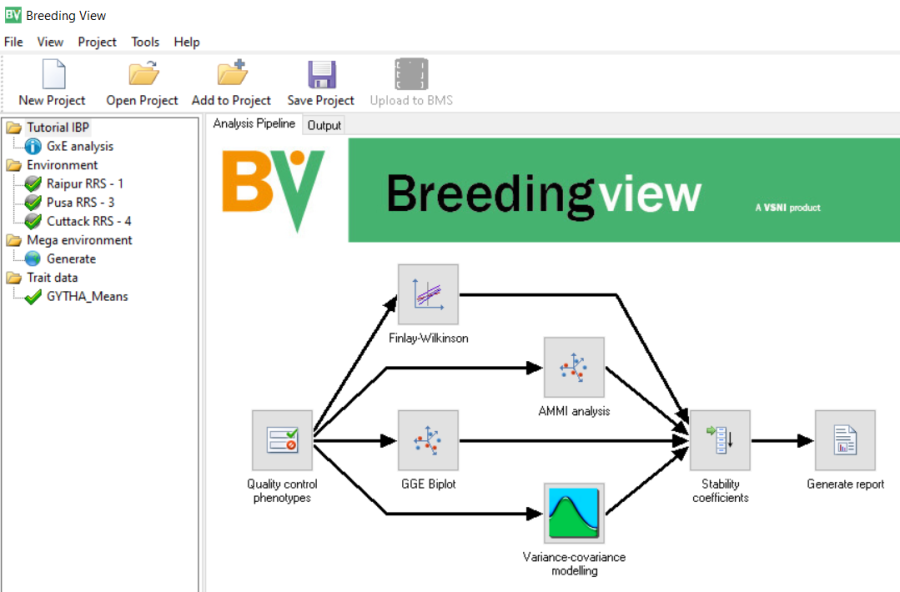
To run the analysis right-click on the Quality control phenotypes icon and select Run pipeline.
The analysis will run, and provided there are no data errors will complete with a report page: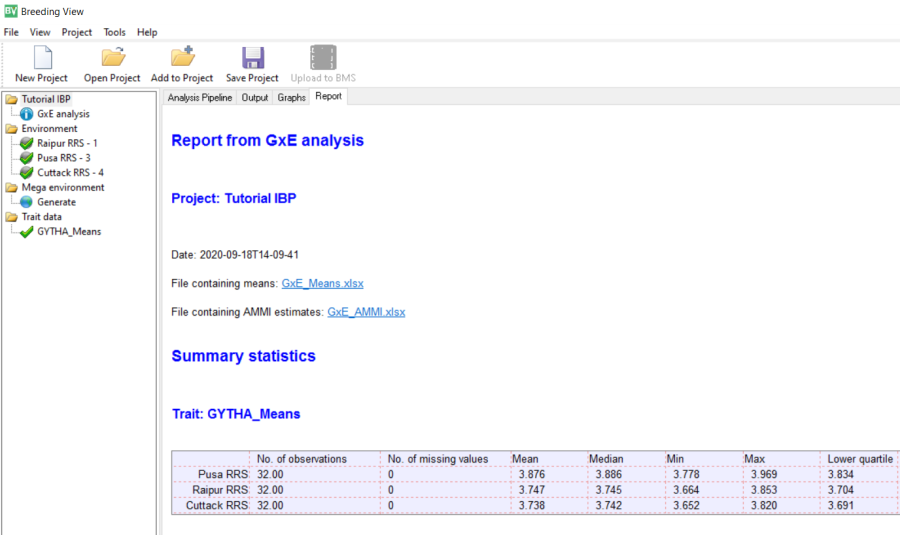
There is a detailed explanation about the report in the manual at:
https://bmspro.io/1949/training/breeding-management-system-manual-50/genotype-by-environment-analysis v21 Genotype by Environment Analyses